Boost Your Android App 2: Mastering Memory Profiling
In the realm of mobile app development, performance is a cornerstone of user satisfaction, particularly on the Android platform. Following CPU Profiling article , effective memory management becomes crucial in Memory Profiling. This is where ‘Memory Profiling’ comes into play. This article delves into the significance of Memory Profiling in Android, how to detect memory leaks, and optimize our apps by resolving these issues.

Why Is Memory Profiling Essential?
In Android apps, memory management is pivotal for efficient performance. Utilizing a Memory Profiler helps in meticulously monitoring the app’s memory usage, identifying memory leaks and other memory-related issues. Without memory profiling, unexpected memory leaks and performance issues could arise, negatively impacting the user experience and jeopardizing the app’s success.
So, What are Memory Leaks and How Do They Occur?
A memory leak occurs when an app fails to release memory that is no longer in use. This often results from objects being retained in memory longer than necessary. For instance, a memory leak can happen if objects tied to an Activity’s context remain in memory even after the Activity has ended. Another example is the careless use of static variables. These mistakes can lead to inefficient memory use and ultimately cause the app to crash. Later in this article, we’ll explore specific examples of memory leaks and demonstrate how to fix them.

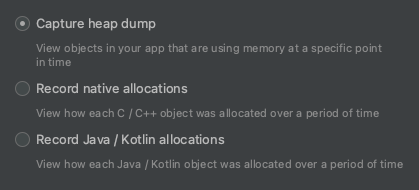
With Android Studio.Memory Profiler tool allows us to take heap dumps — a snapshot of the app’s memory state — to observe which objects occupy memory space. This enables the easy identification of objects unexpectedly consuming memory and potential memory leaks. includes several features, among which “Capture Heap Dump,” “Record Native Allocations,” and “Record Java/Kotlin Allocations” are significant. Each serves a different purpose and provides various insights into your app’s memory usage.

A- Capture Heap Dump:
A heap dump is specific moment in time. When you capture a heap dump, you’re taking a snapshot of the app’s memory, which includes information about all the objects, their fields, the primitives they hold, and how they’re interconnected.
Usefulness: It’s especially useful for identifying memory leaks.
B- Record Native Allocations:
This feature tracks memory allocations in the native code of your application. Native allocations are memory usages from code written in C or C++, which is outside the scope of the Java/Kotlin runtime.
Usefulness: It’s crucial for apps that use native libraries or have parts of their codebase in C/C++.
C- Record Java/Kotlin Allocations:
This records memory allocations that happen in the Java or Kotlin code of your app. It tracks object creation and can provide a stack trace for each allocation, helping you understand where in your code these allocations are happening.
Usefulness: It’s useful for identifying memory-intensive areas in your app’s Java/Kotlin code.
Heap dumps are more suited for detecting memory leaks and analyzing overall memory usage patterns. In contrast, allocation records are more useful for tracking down specific instances of memory allocations and understanding their causes.

What Do We Gain by Profiling Memory
By identifying and resolving memory leaks, we ensure our app’s stability and enhanced performance. This increases user satisfaction, extends the app’s lifespan, and broadens its user base. It also reduces maintenance costs and makes the development process more efficient.
How Can We Do It?
Step 1 Open on Profiler With “+” your Project Process. (3.0)

Step 2 Select your option with our explained on the top side and click Record. (3.1)

Step 3 See on the left side Heap Dump output like that . (3.2)

Step 4 Check the Memory Leaks (3.3) and you can filter classes by Activity &Fragment (3.4), or you can search for our keys in the right side with Cases&Regex(3.5)


Depth ;
In Android, the garbage collector root refers to essential objects that are required for the application to run and cannot be cleared from memory. Usually these root objects; running activities, service connections, and other objects used by the system.
The depth value of an object refers to:
Low Depth Value: If an object has a low depth value (such as 0, 1, or 2), that object is close to the garbage collector root. This means that the object is actively being used and is not expected to be cleared from memory.
High Depth Value: If an object has a high depth value, it means it is further away from the root and is less ‘reachable’. Such objects are objects that can potentially cause memory leaks. Because these objects may remain in memory for a long time and may occupy memory unnecessarily.

Step 5 Jump to source which you fix memory leaks. (3.7)

How Can We Reduce It?
Example 1 Nullable View Binding on Fragment
Within the fragment lifecycle, the view hierarchy is created and destroyed between the onCreateView and onDestroyView methods.When onDestroyView is called, the Fragment’s view is marked for garbage collected. If you have a reference with a ViewBinding and that reference is not set to null, this view hierarchy will be prevented from being properly cleared from memory. Because the binding object contains references to views, which may prevent the garbage collector from cleaning these views. Because in some cases, the Fragment may have been destroyed while the Activity was alive. For these reasons, we set null in onDestroyView.
override fun onDestroyView() {
    super.onDestroyView()
    _binding = null <-
}
Example 2 Static Context References
It may cause it to be kept in memory for a longer period of time.
//Possible Leaks if you use context on View Holder
itemView.setOnClickListener {
    val intent = Intent(itemView.context, ....) -> Context
}
//Leak Fix move to that logic to adapter and use callbacks
var onItemClick: ((String) -> Unit)? = null
//in onCreateVH
val itemView = LayoutInflater.from(parent.context)<- //parent's contextExample 3 Do not use Directly Activitiy on Fragment
If the Fragment still tries to access this Activity while the Activity is being terminated, the application may crash or exhibit unexpected behavior. Reduce Activity dependencies.
//Possible Memory Leak
val mainActivity = activity as MainActivity
mainActivity.someMethod()
// Use some interface
interface FragmentInteractionListener {
fun someSpecificMethod()
}
// Use override on actiivty and call it on fragment like that
private var interactionListener: FragmentInteractionListener? = null
private fun someMethod() {
interactionListener?.someSpecificMethod()
}
// Do not forget set nullable Strong Reference
override fun onDetach() {
super.onDetach()
interactionListener = null
}
/* Setting interactionListener to null in the onDetach()
method indicates that the Fragment is completely
detached from the Activity and is no longer
associated with that Activity.
*/Some time in Fragment requireContext or requireActivity instead of Directly use context or activity.
Example 4 Coroutines lifecycle management
If coroutines do not work in compliance with the ViewModel’s life cycle, it causes memory leaks
//Possible Memory Leak
private val job = Job()
private val scope = CoroutineScope(Dispatchers.IO + job)

fun fetchData() {
    scope.launch { // Coroutine running need to stop
        val data = repository.getData()
        ...
        ..
        .
    }
}
// We can use manuely View Model Lifecycle management
override fun onCleared() {
job.cancel()
}
// We can use viewModelScope cause aware of View Model Lifecycle
fun fetchData() {
viewModelScope.launch {
val data = repository.getData() ...
}
}Example 5 Manuel View Model Lifecycle Management
Creating a Viewmodel manually and manually managing this lifecycle can cause Memory Leaks. Instead, we can use delegates.
//Possible Memory Leak
private var viewModel =  MyViewModel() or ViewModelProvider
If we use this way we need to manage correctly some examples ;
class MyViewModel : ViewModel() {
 private val networkRequest: NetworkRequest// Do not think this now just focus Memory leak
 private val dbHelper = MyDatabaseHelper(application)
 private val database: MyDatabase = MyDatabase.getInstance(application)

// This is important for manuel lifecycle
override fun onCleared() {
 super.onCleared()
 networkRequest.cancel()
 dbHelper.close()
 database.close() }
But we can use delegates ;
//Reduce memory leaks with View Model Lifecycle aware delegates
by activityViewModels() or by viewModels()
Apart from this, there are many other examples, please be careful by researching what I am about to write;
- Handler and Runnable’s -> removeCallbacks
- Singleton “Pattern” -> instances
- Broadcast Receivers -> unregisterReceiver
- Callbacks -> clean callbacks
- AsyncTask or Threads -> If you don’t use Coroutines use “cancel” or “WeakReference”
Conclusion; Effective Memory Profiling is key to success in Android app development. By optimizing memory management, you can boost your app’s performance, enhance user experience, and support your app’s market success. This article aims to guide Android developers through the essential steps and critical aspects of this process.
note : Note: For further insights, you can refer to Android Developers’ videos for some parts.
For Jetpack Compose Fully Projects
Jetpack Compose with Hexagonal and Clean Architecture
Multi Module( Layer Based)with Clean Architecture & MVVM+MVIÂ
Boost Your Android App with CPU Profiling
