Boost Your Android App 1: A Guide to Profiler & CPU Profiling
With smartphones becoming an indispensable part of our daily lives, the performance and efficiency of mobile applications have become critical for user experience. Especially on the Android platform, with its wide range of devices and varied hardware specifications, ensuring applications run smoothly requires impeccable performance optimization. The key to this optimization lies in profiling CPU (Central Processing Unit), Memory, and Energy.
Definitions
1-) CPU Profiling: Understanding how much time your application spends on the CPU and which functions consume the most CPU power can guide you in identifying areas of improvement to make your application run faster and smoother.
sample for our life : To ensure swift user experiences on e-commerce sites, developers utilize CPU profiling. It identifies bottlenecks in backend operations, such as product searches, leading to quicker response times and enhanced user satisfaction.
Before the code part lastly we need the talk about Tracing Types in CPU Profiler include:
A- Callstack Sample: We can check Function or Methods placement at the Stack. This method may not be detailed enough to construct.
B- System Trace: It an important role in the analysis of Multi Thread problems. We can see the Thread Lifecycle and take precautions by making inferences from there. We can also see services, network operations, other running systems such as calendars, etc. here.
C- Java-Kotlin Method Trace: It helps you understand which methods in your application are consuming the most CPU time. This tracing type provides one of the most detailed insights, making it instrumental in diagnosing performance issues.
D- Java-Kotlin Method Sample: You can check how many times a method is called every second. It captures instant situations at certain time intervals.
note : If you want an overview and want to quickly obtain a profile with minimal performance impact, you can choose the Sampling Method. However, if you need more detailed and specific information, you should use the Tracking Method.
How Can We Do It?
Step 1 Open on Profiler With “+” your Project Process. (1.0)

Step 2 Select your option with our explained on the top side. (1.1)

Step 3 See Touch Event like that. (1.2)

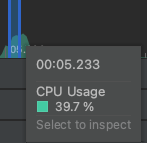
Step 4 Check the CPU Usage&Increase on the top. (1.3)

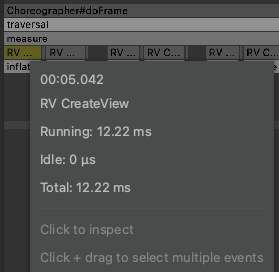
Option 1 See how long which process takes (2.0)

Option 2 Check Threads for UI blocking cases or etc. (2.1)

Option 3 Check All Functions & States. (2.2)

Option 4 Check Your Functions & States & Flows deeply. (2.3)

How Can We Reduce It?
Example 1
We can increase CPU usage by performing intensive calculations within a for loop:
init {
    for (i in 0..100000000) {
        sin(i.toDouble())
    }
}
What we needs to be done?
For this example we can use Coroutines. Simply for those who don’t know light-weight Threads.
…light-weight threads. So, what does light-weight mean? With each thread typically reserving a fixed amount of memory, like 1MB, for the stack. This can be resource-intensive when spawning many threads.Coroutines dynamically allocate memory, consuming resources only when active.
init {
   CoroutineScope(Dispatchers.Default).launch {
        for (i in 0..100000000) {
            sin(i.toDouble())
        }
    }
}
Example 2
When we need to get data from Local Database ( Room Example )
val getDataFromDB = myDao.getAllUsers()
..
exampleAdapter(getDataFromDB)
Running a large query on the main thread may cause the application to freeze with CPU.
What we needs to be done?
It starts with Coroutine launch, IO and Dispatcher, which is optimized for Input&Output operations, are determined. They use background threading threading. And after with withContext we change the Coroutine working Dispatcher to Main cause we need the use something for UI.
CoroutineScope(Dispatchers.IO).launch {
    val getDataFromDB = myDao.getAllUsers()
    withContext(Dispatchers.Main) {
        ...
       exampleAdapter(getDataFromDB)
    }
}
Example 3
Unnecessary UI redraws. For example, a value comes from the backend and we update the UI according to this value.Consider this as a hypothetical example to illustrate the concept.
fun getDataFromBackendAndUpdateUI(data: String){
    binding.constantlyRenewedTextView.text = data
}
What we needs to be done?
if (textView.text != data) {
    binding.constantlyRenewedTextView.text = data
}
extra information : With State Flow If the new value is the same as the previous value, it does not emit a value again. Basically;
View Model

private val _data = MutableStateFlow("")
val data: StateFlow<String> = _data
fun updateData(newData: String) {
_data.value = newData
}Activity & Fragment lifecycleScope.launch {
viewLifecycleOwner
.repeatOnLifecycle(Lifecycle.State.WhenYouWantYouCanSetOnLifeCycle) {
launch {
viewModel.data.collect {
binding.constantlyRenewedTextView.text = it }....
Example 4
Making simultaneous network requests. Please check my Github open-source codes for Network — Requests. (click and Start with Data Module for requests)
In upcoming articles, we’ll explore the second part: Memory.
Thank you for your time..
For Jetpack Compose Fully Projects
Jetpack Compose with Hexagonal and Clean Architecture
Multi Module( Layer Based)with Clean Architecture & MVVM+MVIÂ
Boost Your Android App with and Mastering with Memory Profiling
